
This guide includes measurement approaches for a variety of building systems including lighting, HVAC/R, indoor air quality, and plug loads, in addition to methods for quantifying savings. The Data Logging Best Practices section on page 18 contains more detailed pointers for successful monitoring studies. We will begin by exploring the topic of whole-building monitoring.
Monitoring whole-building power or energy usage over time can deliver many insights into a facility’s performance. Similar to tracking your vehicle’s miles per gallon fuel consumption rate, looking at whole-building power usage can provide an early alert to developing problems and performance changes. Whole-building data can be collected for any utility service (electricity, natural gas, water, central steam…), and can be utilized in a variety of ways. Analyzing the data can direct building professionals to opportunities for achieving energy savings or help verify the effectiveness of implemented energy efficiency measures. Wholebuilding data can be used for the purpose of benchmarking a building to facilitate the comparison to other buildings of similar type. It can also be used to size renewable energy systems or to explore the potential of demand response or load shifting strategies. Additionally the relationship between weather conditions and a facility’s energy use can be established using climate data, whole-building utility data, and simple regression models.
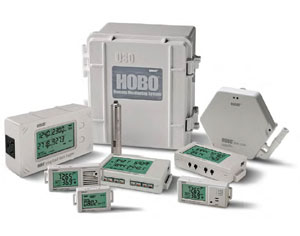
With smart meters, average power (kW) data is readily accessible from the local utility provider in intervals of 15-minute readings. In addition, a portable power logger can be temporarily installed on the facility’s main panel to track usage. While these loggers will not provide data within utility-grade accuracy ranges, it is not unusual for their specifications to be within 1%.They typically provide the added benefits of a full spectrum of power-monitoring capablities to record voltage, current, kW, kWh, power factor, etc., at a wide range of user-define intervals.
Heating, ventilation and air conditioning (HVAC) systems are typically among the largest energy consumers in commercial buildings. As a result, improving their efficiency is an especially efective way to reduce energy use and the costs associated with it. From the system’s key components including chillers, boilers, air handlers, packaged systems, economizers, fans, motors and duct work, to the fine points of scheduling and control systems, looking closely at HVAC system operation presents opportunities to benefit building owners, facility mangers, and occupants.
With the multifaceted and ever-changing needs associated with maintaining indoor air quality and providing thermal comfort, HVAC systems comprise an equally complex interaction of individual components and dynamic, interdependent systems. While a building’s energy management system (EMS) plays a vital role in monitoring and controlling many functions, the system’s age, complexity or functionality can present limitations to readily-accessible data. Portable data loggers can be instrumental in filling in those gaps of information andalso in verifying proper EMS sequences of operation and control strategies.
One of the most critical and prevalent parameters across the full spectrum of HVAC systems is temperature – outside air, mixed air, return air, supply air, discharge air, chilled water, condenser water, heating water, temperature stratification issues, etc Using portable USB or Bluetooth Smart enabled data loggers to track, monitor, and verify temperatures are among their most beneficial and productve investigations.
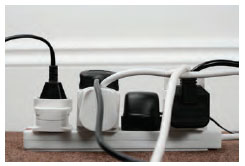
Plug loads are among the fastest growing sources of energy use in commercial buildings today, with office equipment and other miscellaneous plug loadsconsuming more than 20% of electricity in California’s offices2 Computers, monitors, imaging equipment, and server rooms lead the pack as high energy-use offenders, followed by task lighting, space heaters, projectors, TVs, vending machines, kitchen equipment, and even cell phone chargers. Computer server rooms fall into this category and are one of the fastest growing energy systems in the US.3.
Plug-in devices often have the ability to operate at various power levels including active, standby, sleep, and off modes (nomenclature varies by manufacturer) – each using decreasing amounts of power. A device that is reduced to ‘standby’ mode (screen saver on a computer, for instance) is still likely to be consuming a significant percentage of its fully-acive power usage, as it is available to begin performing immediately upon request by the user. In ‘sleep’ mode, the equipment has been powered down further, and the user will experience a short delay while it returns to its active mode. Even in ‘off’ mode, some devices continue to consume power. These so-called vampire or parasitic loads are typically associated with instant-on capabilities, internal clocks, battery charging, LCD displays, or LED lights.
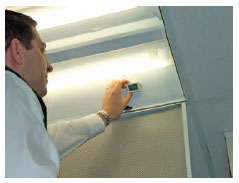
The portion of a commercial building’s energy consumption that is attributable to lighting will, of course, vary among building types, locations, building functions, and other variables. What is unquestionable, though, is that lighting is a major contributor to total energy costs, typically representing 20 to 50%.4 Shifting to energy-efficient lighting is generally considered the easiest ad most profitableinvestment compared to other energy-saving opportunities applicable to commercial building systems. Lighting energy use can be signifiantly reduced while still maintaining or even improving function, aesthetics, and productivity. An often overlooked additional benefit to upgrading to newe, higher-efficiencylighting is the reduced heat gain which leads to decreased demands on the building’s cooling and ventilation system. While a portion of this benefit may beoffset during heating mode operation, it is worth noting that inefficient lightingsystems are not the most cost-effective way to heat a space.
Lighting Power Density (in watts/square feet), illumination levels (in foot-candles or lux), and operating hours are key measures for identifying energy efficiencyopportunities. Many energy codes specify limits on Lighting Power Density according to space use or building type. The Illuminating Engineers Society provides recommended illumination levels.
Maintaining the temperature, humidity, and other environmental parameters inside of a building is an occupant health and comfort issue as well as an energy issue. Indoor Air Quality (IAQ) has been identified by the EnvironmentalProtection Agency as one of the top five most urgent environmental risks t public health.6 With the majority of Americans spending the bulk of their time in enclosed environments, the effects of indoor air pollution can be greater than that from outdoor air pollution. Common indoor air contaminants and sources include carbon monoxide, carbon dioxide, molds and bacteria, tobacco smoke, outdoor air pollutants such as pollen and dust, and volatile organic compounds emitted from a wide range of products such as paints, cleaning supplies, pesticides, building materials and furnishings, and office equiment.
Building codes define the appropriate ventilation rates for speific facility types.Many of these standards reference ASHRAE’s Guideline 62.1: Ventilation for Acceptable Indoor Air Quality. The document includes operations and maintenance guidance for building operators regarding the mitigation of many IAQ problems.

As the interface between the interior of the building and the outdoor environment, the building envelope serves as a key defensive thermal barrier, having a critically important impact on the amount of energy needed to maintain indoor comfort. Minimizing heat transfer through the building’s walls, roof, windows and foundation reduces the need for both heating and cooling. The building envelope can significantly impact HAC and lighting requirements, typically the two largest end uses of energy in commercial buildings.
Data loggers are useful in tracking parameters that provide insight into envelope performance. Other sections of this guide address some of their specific abilitiesassociated with monitoring temperature and light levels. In the example graphed in Figure 9, loggers were utilized to determine the source of moisture in a room.
Unlike some parameters, energy savings cannot be determined with a single measurement. Instead, energy savings are quantified in relationto a reference situation. For example, energy savings is the difference between energy consumption before and after an energy efficiency measure is imlemented. In the energy-savings equation (below), the pre-retrofit conditionis identified asthe “baseline” condition. Baseline can refer to any number of conditions that are compared to the proposed condition including the energy use of the existing equipment, the energy use of code-compliant equipment, or the energy use of equipment that qualifies for incentives.
kWh saved = kWh baseline – kWh post-retrofit
Quantifying energy savings comes down to evaluating the reduction in power (kW) and/or hours (h) of operation, and is typically calculated over an annual period. The three main approaches addressed in this guide range from relatively simple to more complex, the suitability of each being directly related to the nature of the energy efficiency measure being investigated and he complexity of the associated system type.
See more details on each of these Energy Savings tactics in the Facilities Managers Guide.